")


I was very impressed with Sissel's Lean Six Sigma knowledge. She makes it easy to identify improvements and create results.

Daryl Powell
Research Manager, Sintef Manufacturing
They took 600 samples per year chasing process problems. Then they discovered the issue was the measurement system.
The production manager stared at the data. The variation made no sense.
They took 600 samples per year on a single process. 30 minutes per filter batch. Manual, subjective check of clarity. The test results varied wildly.
They hunted for causes. Discussed what could be wrong with the process.
Until they discovered: It wasn't the process. It was the measurement system.
As the production manager put it:
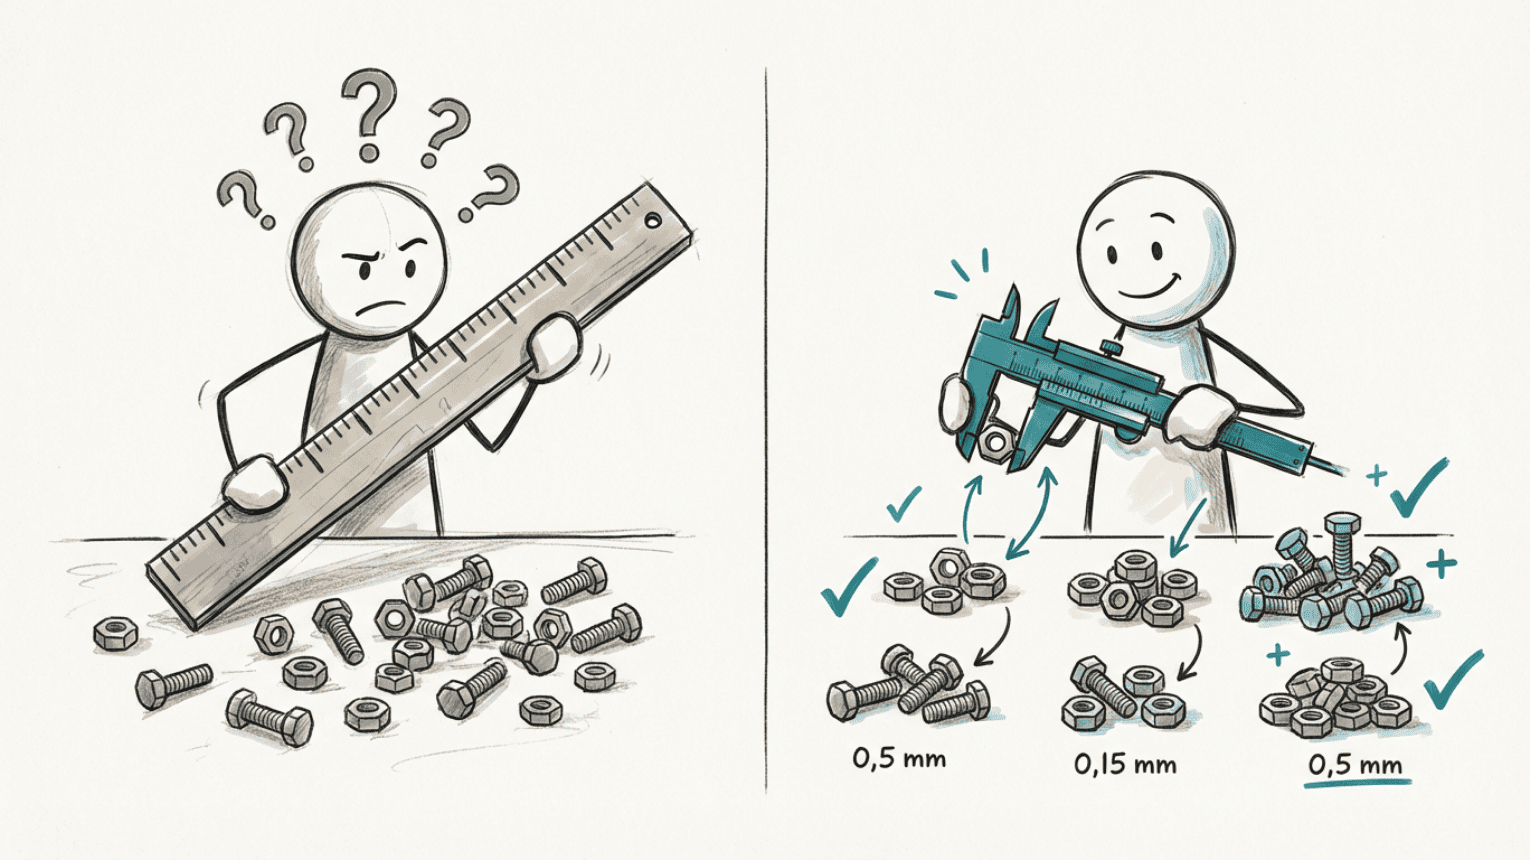
"If you need to sort nuts by size and you've been given a yardstick, you don't stand a chance. But if you have a micrometer, you can sort them precisely."
They had been using a "yardstick" when they needed a "micrometer." The variation they saw came from the measurements themselves, not from what they were measuring.
Problem: 600 manual samples per year with high variation. The team was chasing process problems that didn't exist.
Cause: The measurement system (manual, subjective check) contributed more variation than the actual process.
Action: Replaced manual checks with an online turbidity meter and automated the filter process.
Result: 600 fewer samples per year, 300 hours saved, 10-15% productivity increase, better working environment.
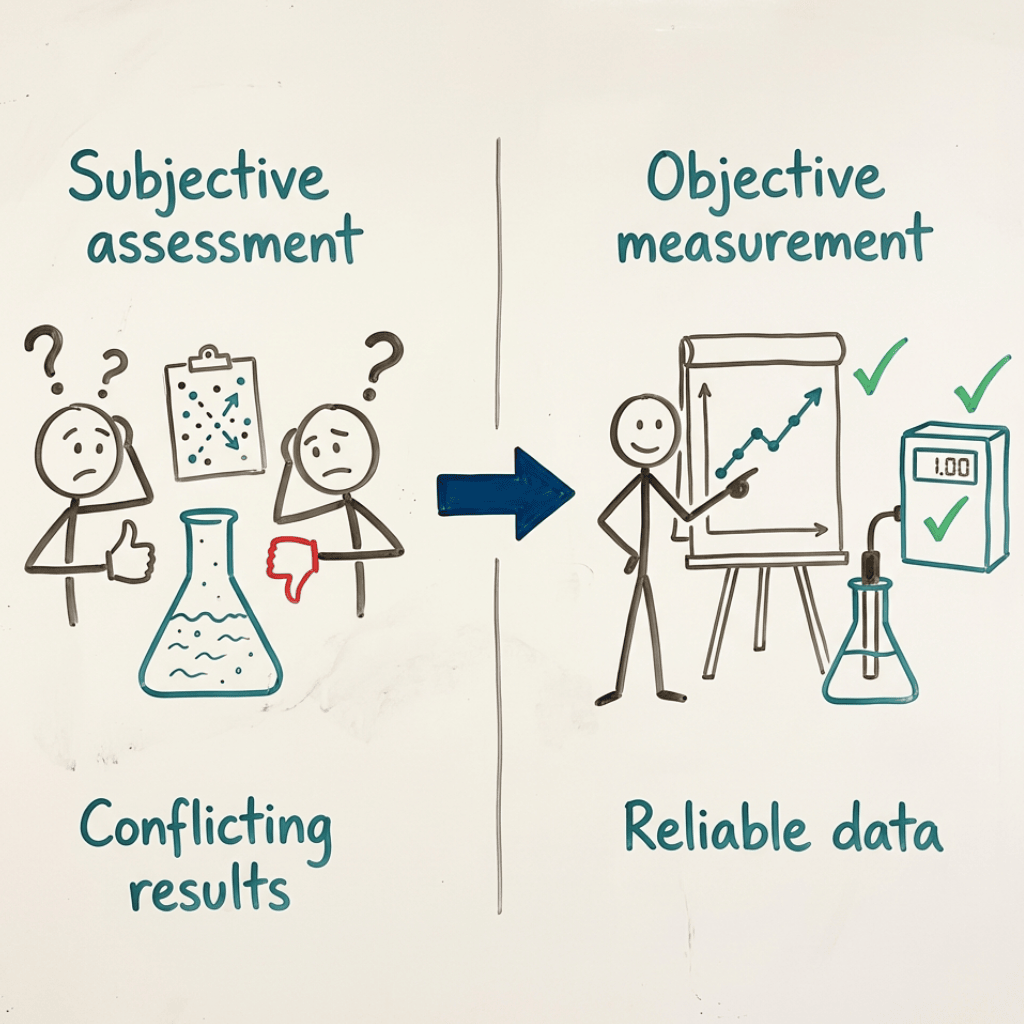
The company had a filtration process where they checked clarity manually. Each batch required a subjective assessment: "Is this clear enough?"
The problem was that answers varied. The same product could receive different assessments depending on who looked at it, when they looked at it, and how the light fell.
When test results fluctuated, they assumed the process was unstable. They searched for causes in raw materials, temperatures, and equipment. They adjusted parameters and tried various fixes.
Nothing helped. The variation continued.
It wasn't until they asked a different question that things changed: "What if the problem isn't the process, but how we measure?"
What this is about: Measurement System Analysis (MSA) evaluates whether your measurement method is reliable enough to distinguish real variation from measurement noise. If the measurement system varies more than the process, you're not seeing reality.
Why it happens: Manual measurements are often subjective. They're affected by operator, timing, lighting conditions, and expectations. Without testing the measurement system separately, you mix two sources of variation together.
How you recognize it:
• Test results vary more than expected
• The same sample gives different results when different people measure
• You discuss whether the numbers are correct instead of what to do about them
• Actions based on data don't deliver expected results
If the measurement system varies more than the process, you're optimizing the wrong thing.
The company decided to replace the manual clarity check with an online turbidity meter. This is an instrument that measures how much light is scattered by particles in the liquid, providing an objective number instead of a subjective assessment.
They also automated the filter process itself, so the decision about "filtration complete" was made by the system based on measurements.
The change eliminated two sources of variation simultaneously: the subjective assessment and the manual handling.
After implementation, they saw concrete improvements:
• 600 fewer manual samples per year
• 30 minutes saved per filter batch (300 hours per year total)
• 10-15% increase in productivity
• Less exposure to chemicals
• Better working environment for operators
But perhaps the most important gain was this:
They stopped chasing process problems that didn't exist.
With reliable data, they could finally make decisions they trusted.
Maybe you don't take 600 manual samples per year. But I bet you recognize the dynamic:
• Test results vary, and you don't know if you can trust them
• You adjust the process based on measurements, but nothing improves
• The team discusses what's wrong, but no one is sure
• Two people measure the same thing and get different answers
• You spend more time discussing the data than acting on it
When the measurement system contributes too much variation, you chase causes that don't exist and choose actions that don't work.
Step 1: Ask the question
Next time data varies unexpectedly, ask: "Is this real variation in the process, or variation in the measurement?" Don't assume the process is the problem before you've checked the measurement system.
Step 2: Test repeatability
Have the same person measure the same sample multiple times. If results vary significantly, you have a repeatability problem in the measurement system.
Step 3: Test reproducibility
Have several people measure the same sample. If results vary between people, you have a reproducibility problem. Perhaps the procedure is unclear, or the method is too subjective.
Step 4: Evaluate if the measurement system is good enough
Compare the variation in the measurement system with the variation you're trying to detect. If the measurement system "noise" is louder than the signal you're looking for, you need a better measurement method.
What is Measurement System Analysis (MSA)?
MSA is a structured method to evaluate whether a measurement system is reliable enough for its purpose. You quantify how much variation comes from the measurement itself, and how much comes from what you're actually trying to measure.
How do I know if my measurement system has too much variation?
A rule of thumb is that measurement system variation should account for less than 10% of the total variation you see. Between 10-30% may be acceptable depending on the purpose. Above 30% means the measurement system hides more than it reveals.
What's the difference between precision and accuracy?
Precision is about how similar results are when you measure the same thing multiple times. Accuracy is about how close results are to the true value. You can be precise without being accurate, and vice versa.
When should I conduct an MSA?
Before using data for important decisions. Especially when introducing new measurement methods, when data varies unexpectedly, or when actions based on data don't deliver results.
This story is from our weekly newsletter, where we share experiences. Short stories for those who want to solve problems at the root and achieve measurable, lasting value creation.
Sign up for our newsletter:
If you want to learn more about the topics in this post:
• Learn Measurement System Analysis (MSA) in a practical online course
• Understand the difference between noise and signal with statistical process control
• How to find root causes instead of treating symptoms
I was very impressed with Sissel's Lean Six Sigma knowledge. She makes it easy to identify improvements and create results.
Very nice and professional service. Delivered a good job within deadlines.
Sissel's commitment and expertise is impressive. Her contribution to our monitoring program has been precise and targeted, as well as very educational.
We are very happy with the work carried out; with your background and expertise, the outcome was what we were looking for.
Sissel is a competent and committed employee. She has been an important contributor to ensure progress. At the same time, she is accurate and deliveres good quality work.
Lean Tech delivered monitoring program for air emission. The assignment was delivered with the correct content at the right time. Recommended.
Very engaged and focused throughout the course. Sticking to the agenda. Nice and pleasant.
Very good at keeping the right atmosphere, and at driving the participation from all the attendees.
Supply Chain & Automation Manager
"You are inspiring, positive and professionally skilled" "Made a difference, engaged and skilled"
"Inspiring, motivating and patient. Managed to adjust the subject to our level."
"Very knowledgeable. Good answers to all input."
"Excellent! Very clever and engaging"
"Great and fun with the Lego competition."
"Very good! Lots of knowledge and good at communicating."
"Good mix of theory and practice. Fun to try out what you've learned."
Very useful with practical implementation and approach, and that we could relate / transfer to our own workplace.
Inspiring, professionally competent, popularize a theoretical discipline.
Clear and well presented. Good at asking questions and listen (check understanding).
Academic highly skilled and clear performance. Fun and builds trust.
Lean Tech AS | Kristoffer Robins vei 13
0047 481 23 070
Oslo, Norway
L - Look for solutions
E – Enthusiastic
A – Analytical
N - Never give up


