")


I was very impressed with Sissel's Lean Six Sigma knowledge. She makes it easy to identify improvements and create results.

Daryl Powell
Research Manager, Sintef Manufacturing
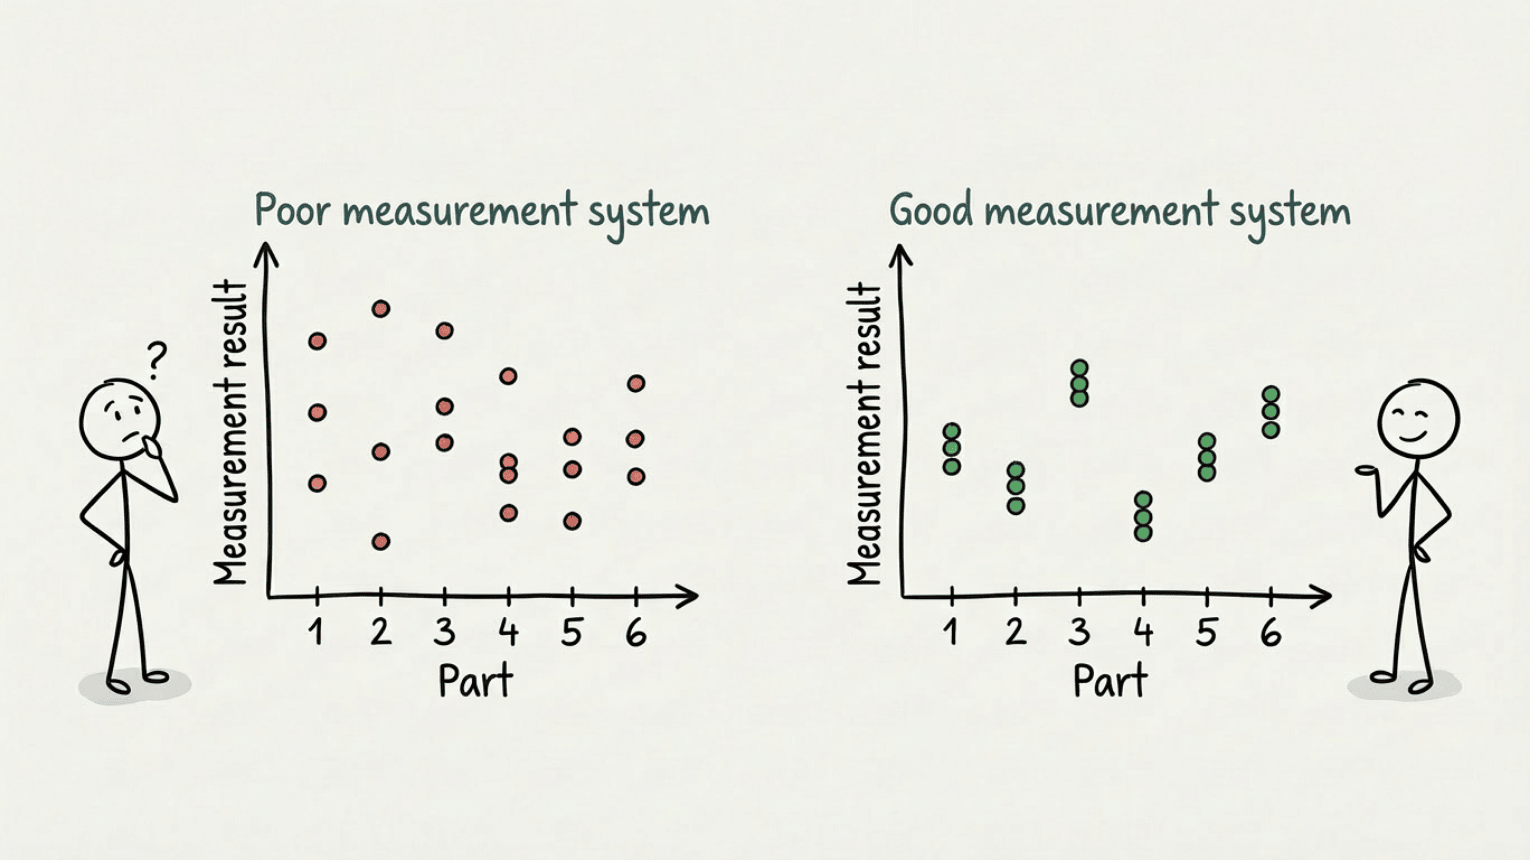
A quality manager reached out. They'd run a measurement system analysis on a surface roughness gauge. The spreadsheet said everything was fine. But was it?
I analyzed the data using control charts.
The conclusion wasn't pretty.
86% of the variation came from the measurement system. 58% from the instrument and method itself. 28% from differences between operators. Only 14% from the actual parts being measured.
The spreadsheet said everything was fine.
It wasn't.
Situation: Quality manager analyzed surface roughness gauge, old spreadsheet said "ok".
Problem: The spreadsheet gave the wrong conclusion—said "ok" when it wasn't.
Cause: 86% of variation from the measurement system, not the parts.
Consequence: Looking for production problems in the wrong place.
In problem solving and process improvement, we often take measurements at face value. We forget that measurement is also a process, with its own variation.
So when we search for the causes of quality problems in production, we're looking in the wrong place.
We should be looking at the measurement process.
When the measurement system varies more than the process, you're often optimizing the wrong thing.
Without a good measurement system, improvement work stops. You can optimize, adjust, and adapt all you want, but if the measurements lie, you're working blind.
This isn't unusual.
Many people trust a statistics program that gives them an answer. An AI tool that spits out a result, or an old spreadsheet no one knows the origin of.
The problem is you don't understand why the numbers say what they say. And then you don't catch it when they're lying.
Control charts give you something different.
You see the variation yourself. You see where it comes from. You don't have to blindly trust a conclusion you can't verify.
Maybe you don't analyze surface roughness gauges daily, but you recognize the pattern:
When you can't distinguish noise from signal in the measurement system, you hunt for causes that don't exist and choose actions that don't work.
Step 1: Ask the question
Next time data varies unexpectedly, ask: "Is this real variation in the process, or variation in the measurement?" Don't assume the process is the problem before you've checked the measurement system.
Step 2: Test repeatability
Have the same person measure the same sample multiple times. If the results vary significantly, you have a repeatability problem in the measurement system.
Step 3: Test reproducibility
Have multiple people measure the same sample. If results vary between people, you have a reproducibility problem. Maybe the procedure is unclear, or the method is too subjective.
Step 4: Assess whether the measurement system is good enough
Rule of thumb: The measurement system's variation should be under 10% of total variation. 10-20% is acceptable. 20-30% is marginal. Over 30% is poor.
What is measurement uncertainty?
Measurement uncertainty expresses the doubt associated with a measurement result. It's often stated as a symmetric interval around the measurement: Measurement result ± measurement uncertainty. Example: A measuring rod of 2000 mm ± 1 mm means the actual length, with 95% probability, lies between 1999 mm and 2001 mm.
What's the difference between precision and accuracy?
Precision is about how similar the results are when you measure the same thing multiple times (low scatter). Accuracy is about how close you are to the true value. You can be precise without being accurate, and vice versa.
What are repeatability and reproducibility?
Repeatability is the degree of variation in repeated measurements taken for the same unit, performed with one instrument or operator. Reproducibility is the degree of variation in measurements performed on the same unit, but by different operators or instruments.
How do I know if my measurement system is good enough?
Test repeatability: Measure the same object multiple times. If results vary significantly, the measurement system isn't reliable enough. Rule of thumb: The measurement system's variation should be under 10% of the total variation you see.
What is sensitivity in a measurement system?
Sensitivity is the resolution of the measurement method. That is, the smallest measurement unit. Rule of thumb: The measurement unit must be at least 1/10 of the customer's tolerance.
What does stability mean in a measurement system?
If bias (deviation from true value) is the same over time, the measurement system is stable. If bias varies, the measurement system is unstable. Environmental factors such as cleanliness, noise, vibration, lighting, chemicals, wear, or other factors can cause instability.
What is linearity?
Linearity is how accurate the measurement system is across its entire measurement range. If the measurement system is linear, it has equal accuracy across the entire range. If there's bias in certain parts of the measurement range, the measurement system isn't linear.
Do I need MSA for all measurements?
No, prioritize measurements used for important decisions. If a measurement determines whether a product is accepted or rejected, you need to know the measurement system is reliable. For less critical measurements, requirements can be lower.
Watch our free video showing how control charts can be used to quantify variation, including measurement uncertainty.
You'll learn:
Get free video: Understand variation with control charts
If you want to learn more about the topics in this post:
I was very impressed with Sissel's Lean Six Sigma knowledge. She makes it easy to identify improvements and create results.
Very nice and professional service. Delivered a good job within deadlines.
Sissel's commitment and expertise is impressive. Her contribution to our monitoring program has been precise and targeted, as well as very educational.
We are very happy with the work carried out; with your background and expertise, the outcome was what we were looking for.
Sissel is a competent and committed employee. She has been an important contributor to ensure progress. At the same time, she is accurate and deliveres good quality work.
Lean Tech delivered monitoring program for air emission. The assignment was delivered with the correct content at the right time. Recommended.
Very engaged and focused throughout the course. Sticking to the agenda. Nice and pleasant.
Very good at keeping the right atmosphere, and at driving the participation from all the attendees.
Supply Chain & Automation Manager
"You are inspiring, positive and professionally skilled" "Made a difference, engaged and skilled"
"Inspiring, motivating and patient. Managed to adjust the subject to our level."
"Very knowledgeable. Good answers to all input."
"Excellent! Very clever and engaging"
"Great and fun with the Lego competition."
"Very good! Lots of knowledge and good at communicating."
"Good mix of theory and practice. Fun to try out what you've learned."
Very useful with practical implementation and approach, and that we could relate / transfer to our own workplace.
Inspiring, professionally competent, popularize a theoretical discipline.
Clear and well presented. Good at asking questions and listen (check understanding).
Academic highly skilled and clear performance. Fun and builds trust.
Lean Tech AS | Kristoffer Robins vei 13
0047 481 23 070
Oslo, Norway
L - Look for solutions
E – Enthusiastic
A – Analytical
N - Never give up


