")

Emissions Monitoring: Ensure Your Measurements Reflect Reality
They had spreadsheets with hundreds of measurements. And kept getting non-conformances. Again and again.
True story
I had a meeting with a client who had spent hours preparing for an audit.
Complex spreadsheets. Countless columns with emission components and discharge points. Lots of data and history. Everything was documented. Everything was measured.
But they kept getting non-conformances. Again and again.
The EHS manager was frustrated:
"We are doing everything right. We take samples. We document. We follow up. Why do we still get non-conformances?"
I asked to see a process map.
"We already have a process map."
It showed building layouts, arrows and IDs without explanation.
"What is the purpose of this process map?" I asked.
We both laughed a little. Because the process map was trying to serve every purpose at once — and none of them well.
In brief
Problem: The company took systematic samples and documented thoroughly, but still received recurring non-conformances during audits.
Root cause: They measured based on their process knowledge, but could not explain how they knew they were measuring at the right location, at the right time, and that the samples were representative of what was actually being discharged.
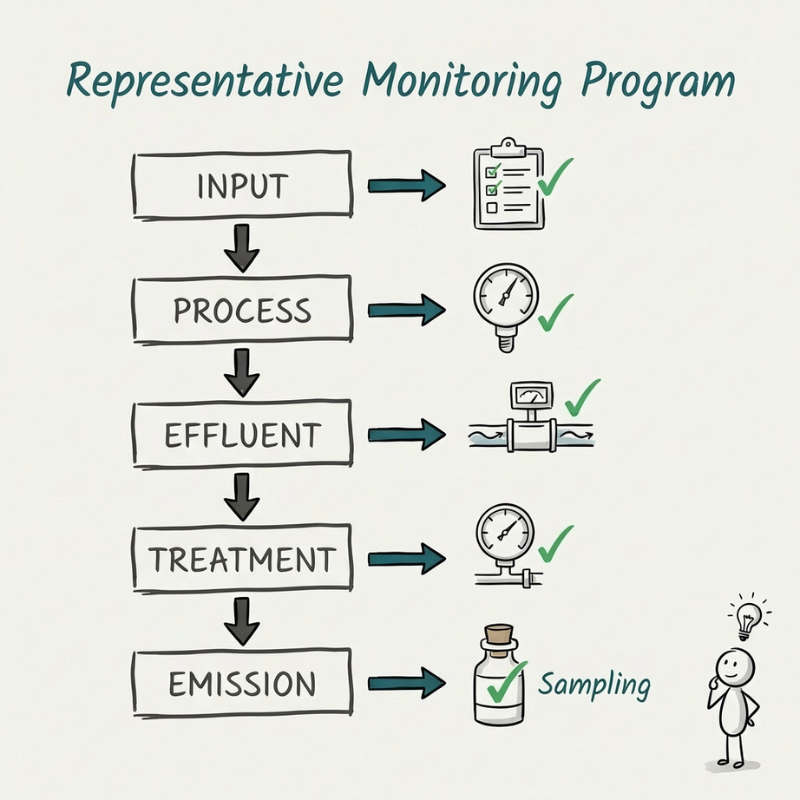
Action: Created a process map with one purpose: understand the processes that generate emissions. Identified discharge points, linked requirements to measurement points, and mapped the water streams from intake through treatment to discharge.
Result: The team could see for themselves where the non-conformances came from. And they got a monitoring program based on process knowledge, with measurements taken at the right time and in the right place.
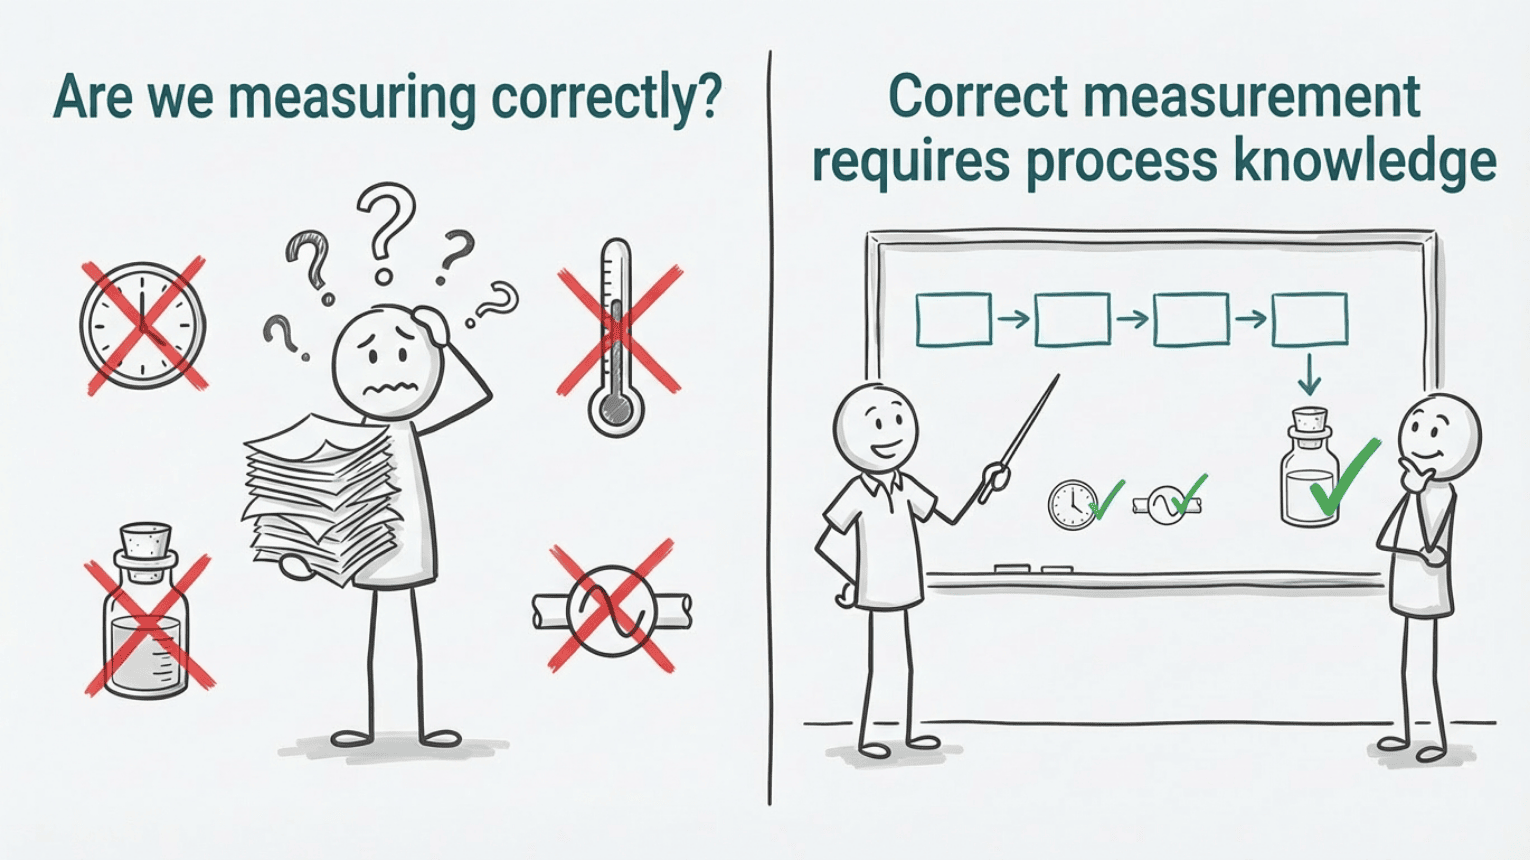
You measure. But is it representative?
An emissions monitoring program is not about collecting as much data as possible. It is about taking samples at the right location and at the right time, analysing with the right method, and interpreting the results based on process knowledge. The measurements must reflect what is actually happening in production.
The challenge arises when no one has asked the question: Is the sample we are taking representative of what we actually discharge?
And you cannot answer that question without understanding the process.
Without process knowledge, you are measuring blind
What this is about: A monitoring program must ensure that measurement and reporting are representative of the actual emissions. That requires knowing your process well enough to know where, when and what to measure.
Why it happens: Many start with the requirements from the permit and work backwards. They build a spreadsheet that covers what the authorities ask for, without asking: does this reflect what is actually happening in our production?
How to recognise it:
• You spend hours preparing for an audit without knowing whether you are in control.
• You get recurring non-conformances and do not understand why.
• Sample results vary significantly, and you do not know whether it is the process or the measurement that is varying.
• The auditor asks questions you cannot answer, because no one has linked measurement points to the process.
• Waste and emissions are high, but you do not know where in the process they arise.
A monitoring program that is not linked to process understanding gives you activity that feels like control, but does not give you insight.
From spreadsheet to process map
We decided to create one process map with one purpose: understand the processes that generate emissions.
We mapped the activities in production. Identified where emissions occurred. Linked requirements to measurement points. Mapped the water streams from intake and consumption, through treatment, to discharge.
We discussed where samples should be taken to be representative of what is actually discharged. It was challenging.
But gradually the full picture became visible. Not just for me, but for the whole team.
"Ah," said one of the process engineers. "That is why we keep getting non-conformances."
What a good monitoring program actually requires
The regulatory requirement is not "as many measurements as possible". The requirement is that the monitoring program has a scope that ensures the results actually reflect the emissions from your facility, over the reporting period.
In practice, that means three things:
Right content. The monitoring program must cover the components explicitly regulated in your permit, plus any reportable components beyond that. What is relevant depends on your process and your permit.
Process understanding and variation. The monitoring program must be built on a mapping of where emissions arise and how they vary, both during normal operation and in situations that can lead to higher emissions: start-up, shutdown, maintenance and treatment out of service. Without this knowledge, you cannot know whether the samples are representative.
Documented measurement chain. It is not enough to say "we take samples". The entire chain must be documented: flow measurement, sampling, analysis, calculation and storage of results. Spreadsheets and databases quickly become black boxes. A simple check of whether results make sense against process knowledge and historical data is good practice.
For production facilities, waste and emissions are closely linked. Reduce emissions, and you reduce waste and costs at the same time. A good monitoring program is not just a regulatory requirement. It is a strategic tool that can be used in improvement work.
Do you recognise this?
• You have spreadsheets with many measurements, but are unsure whether they are actually representative.
• You comply with the requirements in your permit, but the auditor asks questions that reveal the link to the process is missing.
• Variation in sample results is large, and no one knows whether it is the process or the measurement that is varying.
• Waste and emissions are discussed in two separate meetings, even though they are two sides of the same issue.
• New employees in the EHS role do not understand the process map because it was created to satisfy the auditor, not to understand the process.
The result? You spend resources on documenting instead of improving. And the next audit is just as demanding as the last one.
What you can do
Step 1: Determine which components are relevant
Start with the permit. List all components with limit values, frequency requirements or reporting obligations. Then check whether there are reportable components beyond the permit. What is relevant depends on your process and your permit.
Step 2: Map the processes that generate emissions
Draw the process with one purpose: find where emissions arise and what drives variation. Involve people who know the operation. Map both normal operation and situations that can lead to higher emissions: start-up, shutdown, maintenance and treatment out of service. Emissions and waste are often raw materials or intermediates that did not become value. When you see it in the process map, the monitoring program simultaneously becomes a map of improvement potential.
Step 3: Ensure representative measurements
For each measurement point, you must be able to answer: Why is this point representative of the actual emission? Is the frequency and timing correct given the variation in the process? Is the analytical method in accordance with the standard? If you cannot measure everything, the selection must be justified with knowledge of the relationship between measured and unmeasured points.
Step 4: Calculate uncertainty
Emission requirements are given as concentration and mass emissions over a period, for example day, month or year. The authorities require that you report figures that include uncertainty. Measurement uncertainty is usually provided by the laboratory. But process variation can also constitute a significant part of the total uncertainty. Where uncertainty is high and the contribution to total emissions is large, you should prioritise action — on measurement method, frequency or sampling point.
Frequently asked questions
What must a monitoring program minimum contain?
A monitoring program must describe what is measured, where it is measured, how it is measured, how often and why these choices make the measurements representative. It must cover all regulated components in the permit and document the chain from flow measurement to calculation and storage of results.
How do I know whether the samples are representative?
You must link measurement points and frequency to process understanding and variation over time, including abnormal operating conditions. If you cannot explain why the measurement points were chosen, you have a risk in an audit — even with a lot of data.
What are COD and BOD, and when are they relevant?
COD and BOD are two ways to describe organic loading in wastewater. Which one you use, and whether you need both, depends on the requirements in your permit and what can actually enter the wastewater from your process.
What is TOC, and when is it used?
TOC (total organic carbon) is used as a parameter for air emissions, particularly for volatile organic compounds. The permit may set requirements for TOC either as average values or maximum values, depending on the process and risk.
What are typical errors when using spreadsheets for emissions reporting?
That calculations become a black box no one understands, that units or constants are not updated, that flow and concentration do not cover the same period, and that no one does a simple check of whether the results make sense against process knowledge and historical data.
What is measurement uncertainty, and why does it matter?
Measurement uncertainty is the uncertainty in the measurement method itself, and is usually provided by the laboratory. But process variation and placement of measurement points also contribute. The authorities require that reported emissions include uncertainty. Without knowing the uncertainty, you do not know whether you are safely within the limits.
How do I use the monitoring program for improvement, not just reporting?
Emission measurements tell you the result. The process map tells you why. Combine the two, and you go from reporting non-conformances to understanding them — and doing something about them.
Want more stories about problem solving?
This story is from our weekly newsletter, where we share experiences. Short stories for those who want to solve problems at the root, and achieve measurable, lasting value.
Sign up for our newsletter:
If you want to learn more about the topics in this post:
• Shared Focus First: The Missing Step in Problem Solving
• Good data quality is essential for trust and improvement
• Root Cause Analysis: From symptoms to lasting results
• Understand the difference between noise and signal with statistical process control (SPC)
Assignments
Contact info
Lean Tech AS | Kristoffer Robins vei 13
0047 481 23 070
Oslo, Norway
Lean
L - Look for solutions
E – Enthusiastic
A – Analytical
N - Never give up